GATE-CH-2010-24-ctrl-1mark
2010-24-ctrl
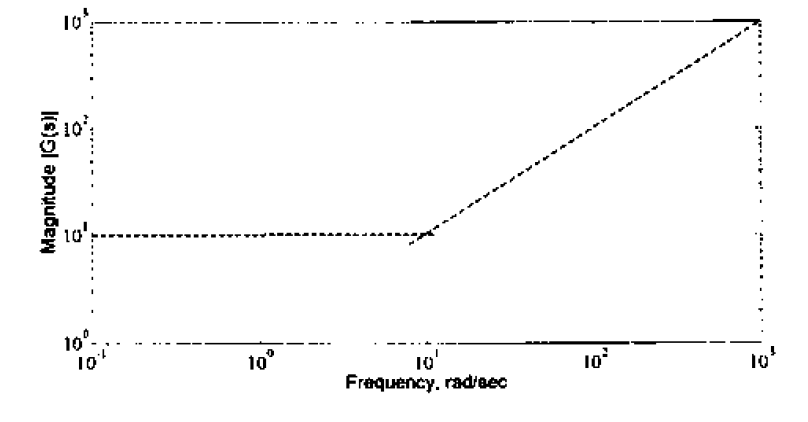
The transfer function, \(G(s)\), whose asymptotic Bode diagram is shown below, is

- \(10s+1\)
- \(s-10\)
- \(s+10\)
- \(10s-1\)
1995-1-q-ctrl
Bode diagrams are generated from output response of the system subjected to which of the following input
1995-1-t-ctrl
According to Bode stability criterion, a system is unstable if the open loop frequency response exhibits an amplitude ratio exceeding unity at frequency for which phase lag is
1998-1-24-ctrl
A first order system with a time constant of 1 min is subjected to frequency response analysis. At an input frequency of 1 radian/min, the phase shift is
1999-1-27-ctrl
A sinusoidal variation in the input passing through a linear first-order system
2000-1-27-ctrl
2000-1-28-ctrl
2002-1-15-ctrl
A first order system with unity gain and time constant \(\tau\) is subjected to a sinusoidal input of frequency \(\omega=1/\tau\). The amplitude ratio for this system is
2002-2-16-ctrl
The frequency response of a first order system, has a phase shift with lower and upper bounds given by
2010-24-ctrl
The transfer function, \(G(s)\), whose asymptotic Bode diagram is shown below, is

2012-25-ctrl
1992-19-b-ctrl

For the loop above, determine:
(i) The maximum gain for stable operation.
{#1}
(ii) The corresponding frequency of oscillation (rad/min).
{#2}
1997-26-ctrl
The open loop transfer function for a process is \(\dfrac {1}{4(3s+1)^4}\), where the time constant is in minutes.
Determine:
(i) the crossover frequency (rad/min)
{#1}
(ii) the ultimate gain.
{#2}
2000-14-ctrl
A feedback control loop with a proportional controller has an open loop transfer function \(G_L(s) = \dfrac {K_c}{s(5s+1)^2}\) where time is in minutes.
(i) The crossover frequency in radians/min = _________
{#1}
(ii)The ultimate controller gain = _________
{#2}
2006-84-85-ctrl
For the system shown below, \(G_1(s) = \dfrac {1}{\tau _1s+1}\), \(G_2(s)=\dfrac {1}{\tau _2s+1}\) and \(\tau _2=2\tau _1\).

When the system is excited by the sinusoidal input \(X(t) = \sin \omega t\), the intermediate response \(Y\) is given by \( Y = A\sin (\omega t+\phi )\).
(i) If the response \(Y\) lags behind the input \(X\) by 45\(^\circ \) and \(\tau _1=1\), then the input frequency \(\omega \) is
{#1}
(ii) For the same input, the amplitude of the output \(Z\) will be
{#2}
1998-2-21-ctrl
The frequency response of a dynamic element shows a constant magnitude ratio at all frequencies. The element exhibits a negative phase shift at all frequencies. The absolute value of the phase shift increases linearly with frequency. The element has the transfer function
2000-2-23-ctrl
2001-2-18-ctrl
An ideal PID controller has the transfer function \(\left[1+\dfrac{1}{0.5s} + 0.2s\right]\). The frequency at which the magnitude ratio of the controller is 1, is
2003-77-ctrl
Find the ultimate gain and frequency for a proportional controller in the case of a process having the following transfer function
\[ G_p(s) = \frac{1}{(4s+1)(2s+1)(s+1)} \]
2004-80-ctrl
Consider a system with open-loop transfer function
\[ G(s) = \frac{1}{(s+1)(2s+1)(5s+1)} \]
Match the range of \(\omega\) (frequency) in Group I with the slope of the asymptote of the \(\log \text{AR}\) (amplitude ratio) versus \(\log \omega\) plot in Group II.
| Group I | Group II |
|---|---|
|
(P) \(0 < \omega < 0.2\) |
(1) \(\quad -5\) |
|
(Q) \(\omega > 1\) |
(2) \(\quad -3\) |
|
(3) \(\quad -2\) |
|
|
(4) \(\quad -1\) |
|
|
(5) \(\quad \)zero |
2005-50-ctrl
The value of ultimate period of oscillation \(P_u\) is 3 minutes, and that of the ultimate controller gain \(K_{cu}\) is 2. Select the correct set of tuning parameters (controller gain \(K_c\), derivative time constant \(\tau_D\) in minutes, and the integral time constant \(\tau_I\) in minutes) for a PID controller using Ziegler-Nichols controller settings.
2006-58-ctrl
A process is perturbed by a sinusoidal input, \(u_t = A \sin \omega t\). The resulting process output is \(Y(s) = \dfrac{K A\omega}{(\tau s+1)(s^2+\omega^2)}\). If \(y(0) = 0\), the differential equation representing the process is
EE-2013-A-15-ctrl
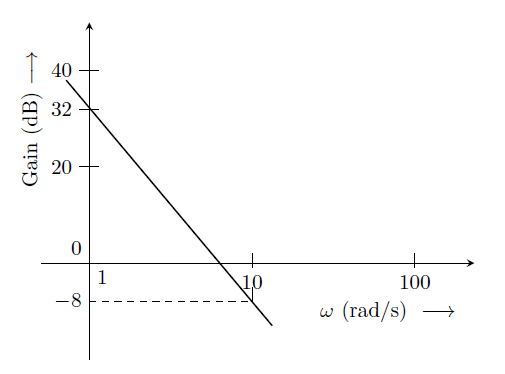
The Bode plot of a transfer function \(G(s)\) is shown in the figure below.

The gain \((20\log |G(s)|)\) is 32 dB and -8 dB at 1 rad/s and 10 rad/s respectively. The phase is negative for all \(\omega\). Then \(G(s)\) is
IN-2014-23-ctrl
2017-51-ctrl
2018-44-ctrl
2019-49-ctrl
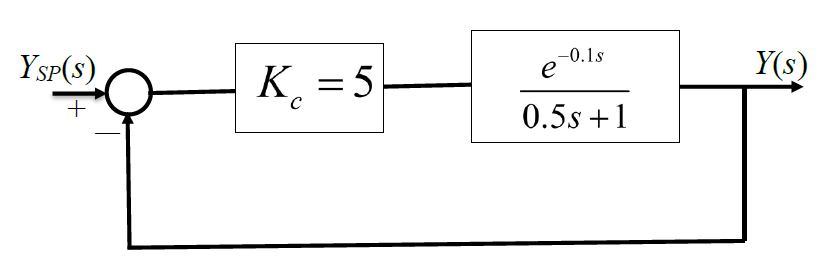
For the closed loop system shown in figure, the phase margin (in degrees) is ___________

IN-2014-46-ctrl
1999-2-18-ctrl
Each item given in the left-hand column is closely associated with a specific characteristic listed in the right-hand column. Match each of the items with the corresponding characteristic.
I. Transportation lag
II. Control valve
Last Modified on: 02-May-2024
Chemical Engineering Learning Resources - msubbu
e-mail: learn[AT]msubbu.academy
www.msubbu.in