GATE-CH-2009-40-cre-2mark
2009-40-cre
An isothermal pulse test is conducted on a reactor and the variation of the outlet tracer concentration with time is shown below:
- 5.0
- 7.5
- 10.0
- 15.0
1999-1-23-cre
The exit age distribution curve ¥(E(t)¥) for an ideal CSTR with the average residence time, ¥(¥tau ¥), is given by
2002-1-8-cre
For an ideal plug flow reactor the value of the Peclet number is
2004-26-cre
For a packed bed reactor, the presence of a long tail in the residence time distribution curve is an indication of
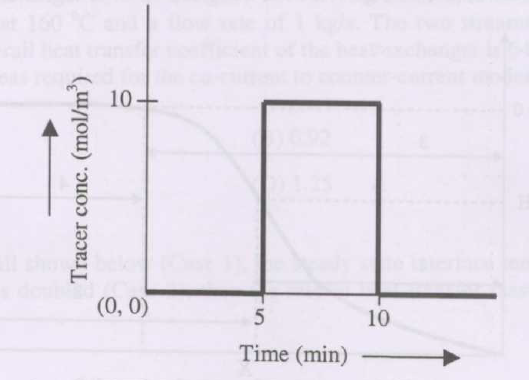
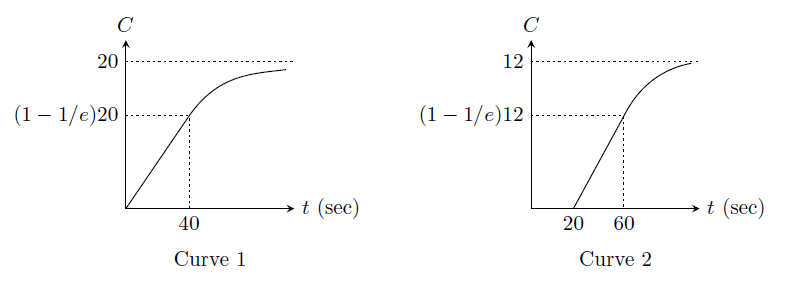
2009-40-cre
An isothermal pulse test is conducted on a reactor and the variation of the outlet tracer concentration with time is shown below:
2014-23-cre
The vessel dispersion number for an ideal CSTR is
2013-21-cre
The exit age distribution for a reactor is given by ¥(E(t) = ¥delta (t - 4)¥), where ¥(t¥) is in seconds. A first order liquid phase reaction (¥(k = 0.25¥) s-1) is carried out in this reactor under steady state and isothermal conditions. The mean conversion of the reactant at the exit of the reactor, up to 2 digits after the decimal point, is ____________
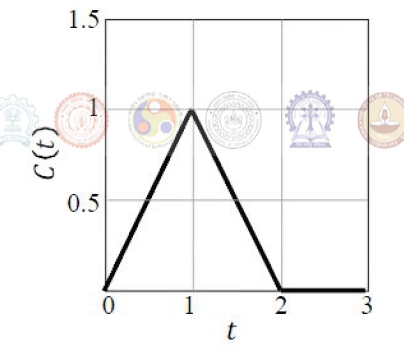
2017-46-cre
The C-curve measured during a pulse tracer experiment is shown below. In the figure, ¥(C(t)¥) is the concentration of the tracer measured at the reactor exit in mol/liter at time ¥(t¥) seconds.
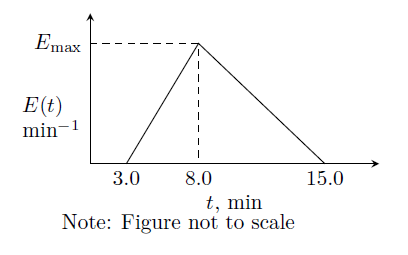
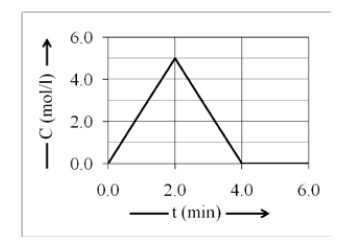
2005-85-cre
The residence time distribution ¥(E(t)¥) (as shown below) of a reactor is zero until 3 minutes and then increases linearly to a maximum value ¥(E_{¥text {max}}¥) at 8 minutes after which it decreases linearly back to zero at 15 minutes.
{#1}
(ii) What is the value of mean residence time in minutes?
{#2}
2008-74-75-cre
A liquid is flowing through a reactor at a constant flow rate. A step input of tracer at a molar flow rate of 1 mol/min is given to the reactor at time ¥(t =0¥). The time variation of the concentration (¥(C¥)) of the tracer at the exit of the reactor is as shown in the figure :
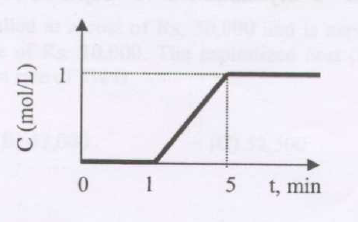
(i) The volumetric flow rate of the liquid through the reactor (in L/min) is
{#1}
(ii) The mean residence time of the fluid in the reactor (in minutes) is
{#2}
2002-2-5-cre
A pulse tracer is introduced in an ideal CSTR (with a mean residence time ¥(¥tau ¥)) at time = 0. The time taken for the exit concentration of the tracer to reach half of its original value will be
2003-73-cre
A step input tracer test is used to explore the flow pattern of fluid through a vessel of total volume equal to 1 m¥(^3¥) having a feed rate of 1 m¥(^3¥)/min.
Identify for each curve in Group 1 a suitable flow model from the list given under Group 2.
| Group 1 | Group 2 |
| P. Curve 1 | 1. PFR and CSTR in series |
| Q. Curve 2 | 2. CSTR with dead space |
| 3. PFR in series with a CSTR and dead space | |
| 4. CSTR |
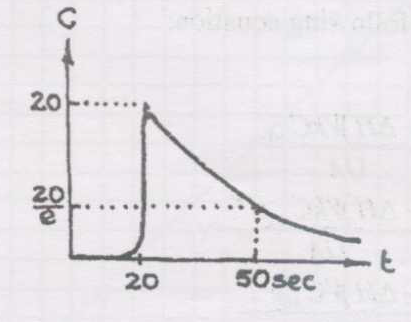
2007-55-cre
A pulse of concentrated KCl solution is introduced as tracer into the fluid entering a reaction vessel having volume equal to 1 m3 and flow rate equal to 1 m3/min. The concentration of tracer measured in the fluid leaving the vessel is shown in the figure given below. The flow model parameters that fit the measured RTD in terms of one or all of the following mixing elements, namely, volume of plug flow reactor, ¥(V_p¥), mixed flow volume, ¥(V_m¥), and dead space, ¥(V_d¥), are
2010-40-cre
Two reactors (reactor 1 and reactor 2) with average residence times, ¥(¥tau _1¥) and ¥(¥tau _2¥), respectively, are placed in series. Reactor 1 has zero dispersion and reactor 2 has infinite dispersion. The residence-time distribution, ¥(E(t)¥) of this system, is given by
2011-43-cre
The following figures show the outlet tracer concentration profiles (¥(C¥) vs. ¥(t¥)) for a pulse input.
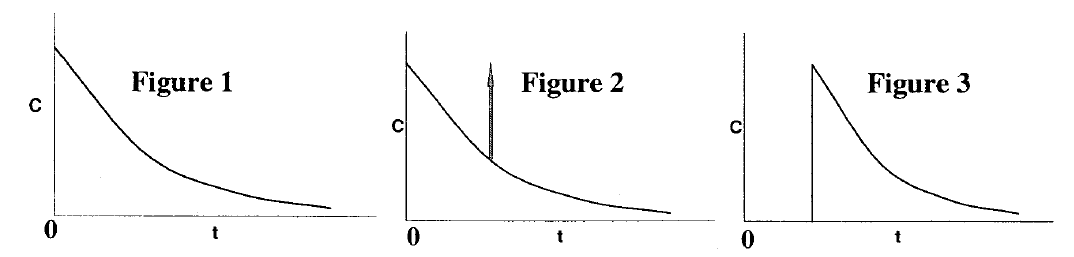
| GROUP I | GROUP II |
|---|---|
| P. Figure 1 | I. PFR |
| Q. Figure 2 | II. CSTR |
| R. Figure 3 | III. PFR and CSTR in series |
| IV. PFR and CSTR in parallel |
2015-48-cre
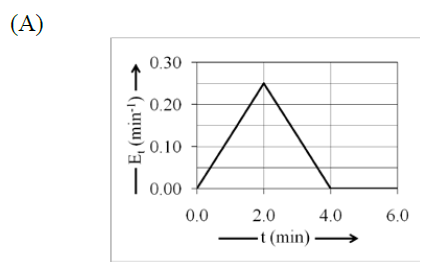
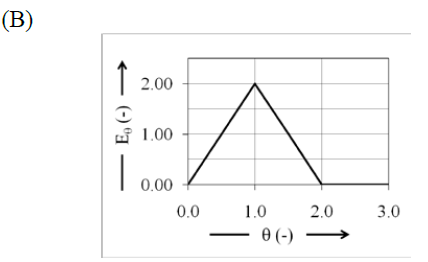
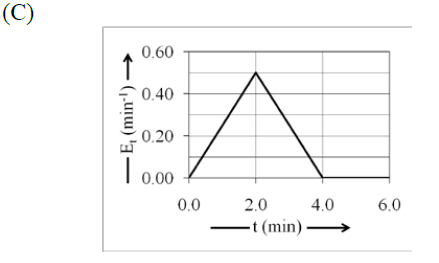
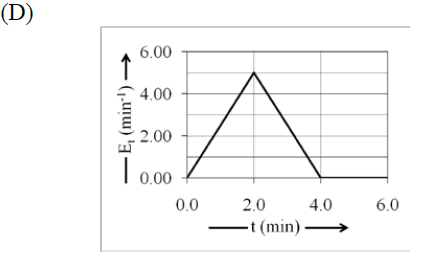
The impulse response to a tracer pulse experiment for a flow reactor is given below:
In the above figure, ¥(C¥) is the exit tracer concentration. The corresponding ¥(E¥) or ¥(E_¥theta ¥) (normalized ¥(E¥)) curve is correctly represented by which of the following choices? Here, ¥(¥theta ¥) is dimensionless time.
2016-50-cre
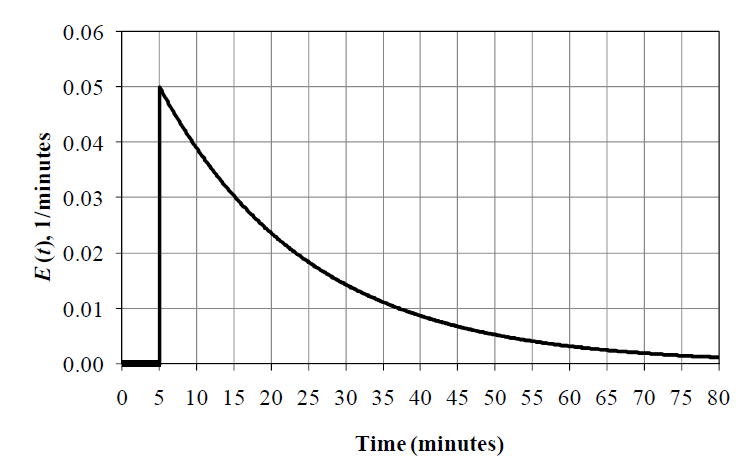
A CSTR has a long inlet pipe. A tracer is injected at the entrance of the pipe. The ¥(E¥)-curve obtained at the exit of the CSTR is shown in the figure below.
1988-7-a-i-cre
In a plug flow reactor, there is a 末末- velocity profile.
Last Modified on: 01-May-2024
Chemical Engineering Learning Resources - msubbu
e-mail: learn[AT]msubbu.academy
www.msubbu.in